Major web app overhaul: advanced usage reporting now live
We've rebuilt the Runware web app from the ground up, improving UI and UX across every dashboard. You can now also see requests, spend, errors, and performance data, along with searchable logs, all in a single reporting view.


We've been hard at work updating the Runware web app. This is a full overhaul, not just how it looks, but how it works. It's built on a new foundation that lets us move faster, ship more consistently, and unlock features that weren't practical before. But the most important part of this update isn't the technology behind it. It's what it enables for users.
The biggest gap we've seen, and heard repeatedly, is visibility. People can run large volumes of requests through the API, but understanding what's actually happening inside an account has been much harder than it should be. You could access logs, but you had to already know what you were looking for. There wasn't a clear way to step back and answer basic questions like where spend is going, which models are being used most, why certain requests are failing, or how consistent performance really is.
That's what this release focuses on fixing.
A single place to understand your usage
The new usage dashboard is built to give you a complete view across everything happening in your account, without needing to piece information together from different places.
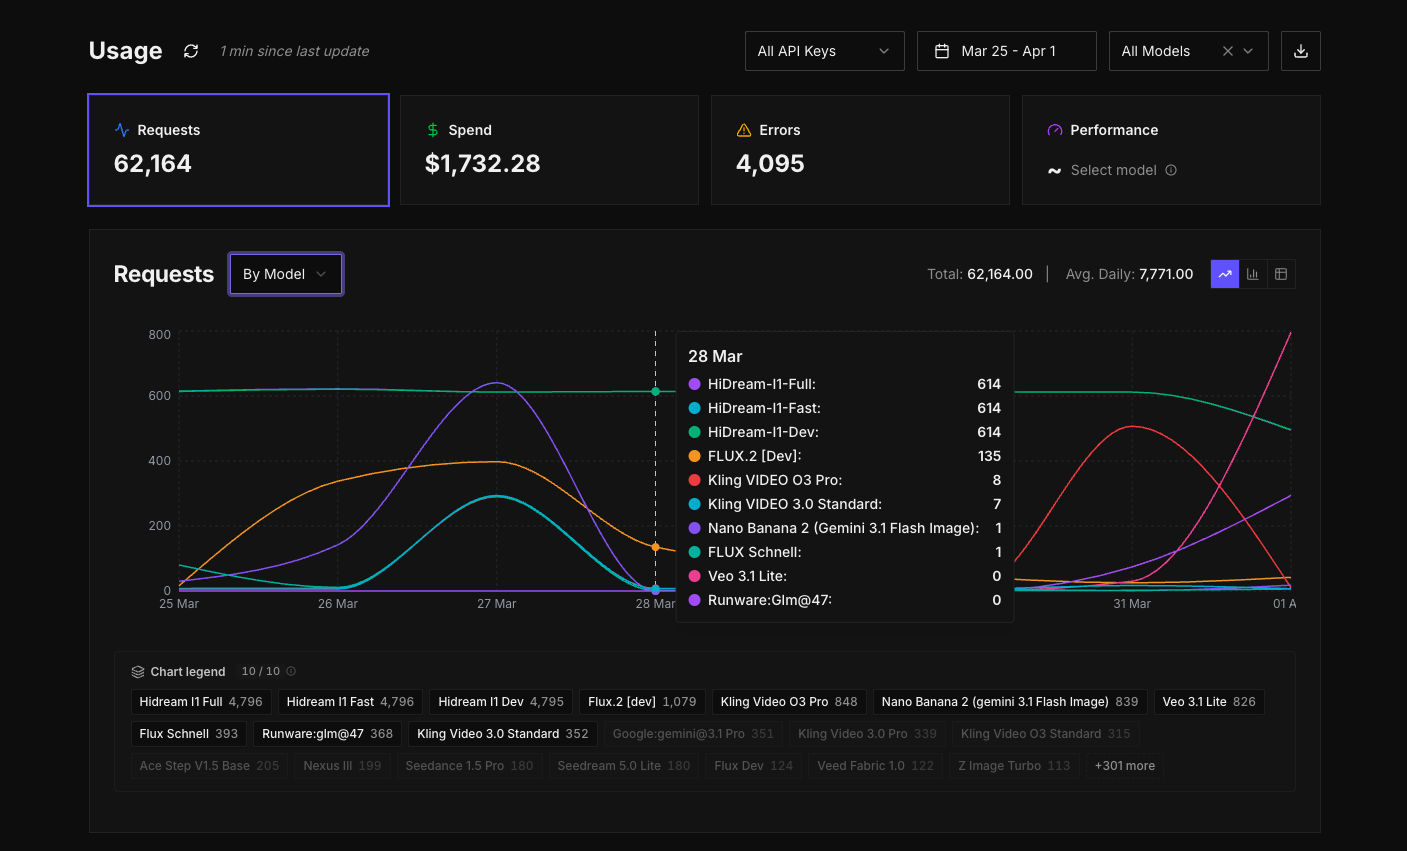
Track usage across models.
Try itInstead of treating requests, spend, errors, and performance as separate concerns, they're now different views from a single interface, over the same underlying data. You can move between them easily, filter them in the same way, and build up an overarching picture of what's going on without breaking your flow.
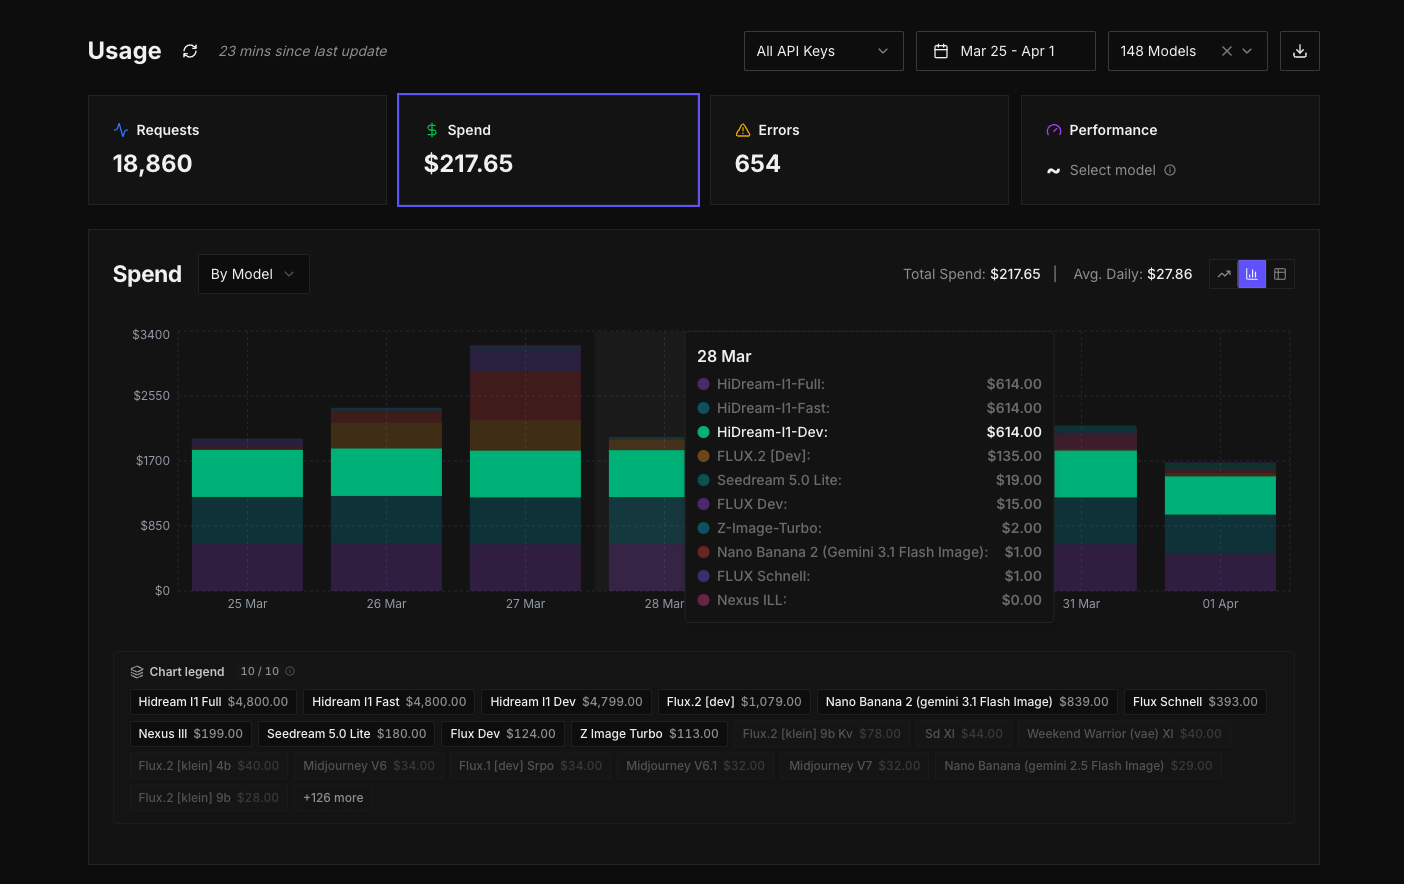
At a high level, you can start by looking at requests or spend to understand overall usage. From there, you can begin to break things down. You might group spend by model and immediately see which models are driving cost. If something looks off, you can narrow it further, switching the grouping to API key or task type to isolate where that usage is coming from. The interface is designed so that you don't need to decide upfront what you're looking for. You can explore, adjust, and refine as you go.
The graph becomes the centre of that experience. It updates as you change grouping or filters, and the legend lets you quickly toggle different series on and off so you can focus on specific models or keys without losing the wider context. The aim here is not just to show data, but to make it easy to move through it and arrive at answers quickly.
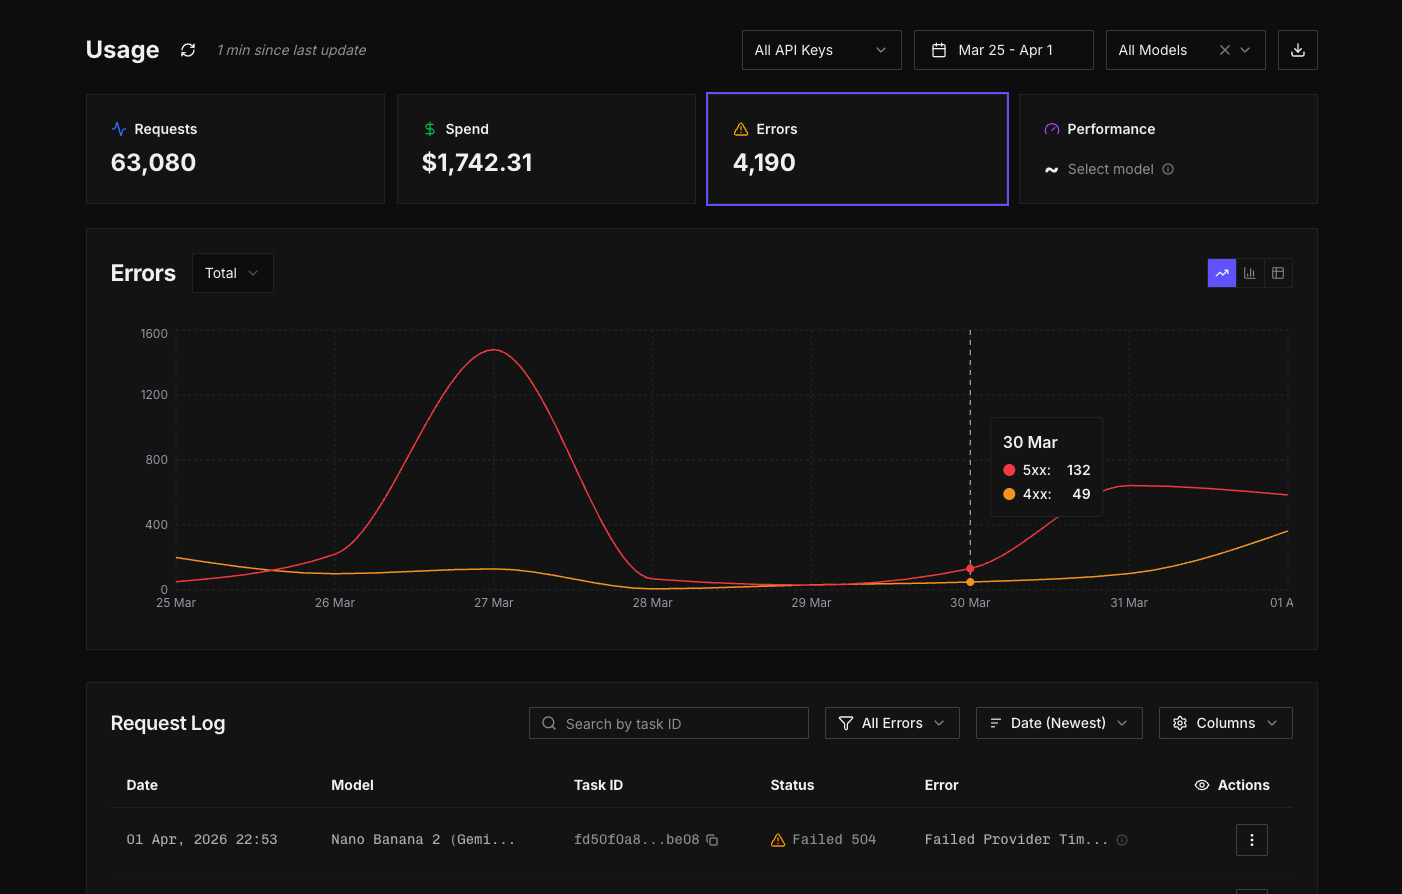
Errors are no longer buried
One of the most important changes in this update is how errors are handled.
Previously, errors weren't exposed in the web app. If you wanted to track them, you had to handle that on your own side using your own tooling. While response codes were available, there wasn't a clear way to view or analyse them directly within the platform.
Now, all responses including detailed error codes are captured and surfaced in a dedicated view. You can see 4xx and 5xx errors clearly grouped, filter down by specific error codes, and understand how those errors are distributed across models, API keys, or time. Instead of scanning raw entries, you can identify patterns. You can see whether a particular model is consistently failing, whether an issue is isolated to a specific integration, or whether it's something broader.
This shifts errors from something reactive to something you can actively monitor and understand. It becomes much easier to catch issues early, trace them back to their source, and fix them with confidence.
Logs, but more usable
Logs still exist, and they remain the source of truth for individual requests, but they're now part of a broader system rather than a standalone tool.
You can apply global filters from the top of the usage page and view logs for specific slices of activity. For example, you can filter down to a particular category, like audio models, and see only the logs that match that context. On top of that, there are additional filters and search controls within the logs view itself, so you can narrow things down further, sort results, and export exactly what you need.
Instead of scanning through raw entries, you can move from a high-level view into logs with the right context already applied, then refine from there.
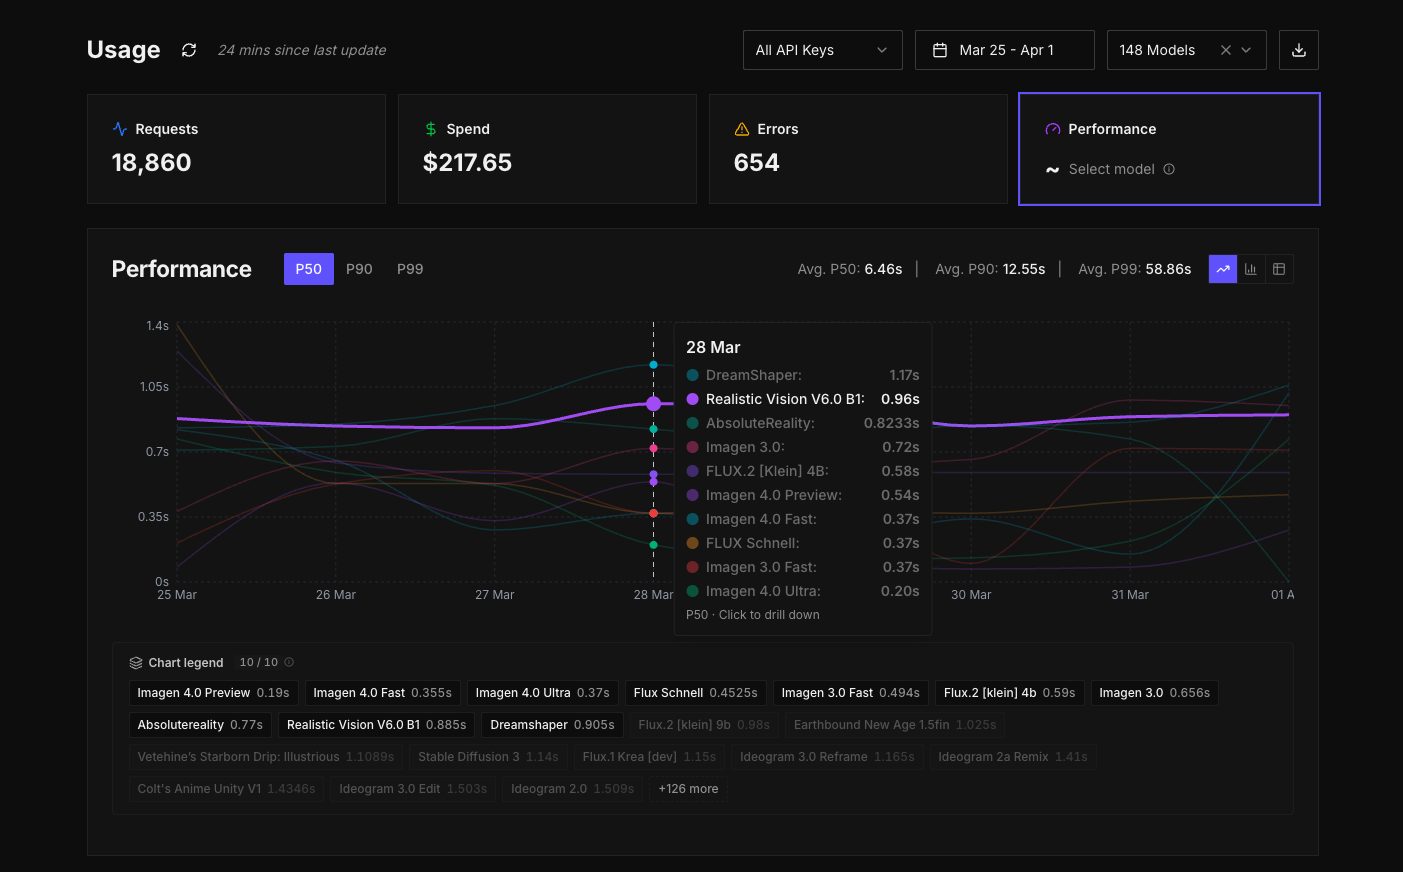
Performance, now available across your account
Performance data is now available across all inference requests in your account.
You can look at performance globally across your account, or drill into a specific model and see how it behaves over time. For each model, you can see P50, P90, and P99 inference times in one place. P50 gives you the median, P90 shows where most requests sit at the higher end, and P99 highlights the edge cases where things take longer.
Taken together, these metrics give you a much better understanding of consistency, not just speed.
A quieter set of improvements across the app
Alongside the reporting work, we've updated the rest of the web app to make it more stable and predictable to use.
Account management has also been improved, with support for budget controls, social sign-in, and enterprise SSO. Session handling has been improved so you stay signed in for longer, and overall performance across the UI/UX has been improved across every dashboard.

Need SSO? Reach out for enterprise access
The model directory now handles pagination and state more reliably, so moving between models keeps your context intact. You can also now search across both models and documentation from a single place in the global navigation, making it easier to find what you need quickly. Model pages are more consistent, and it's easier to access key information without jumping around. Recommended collections help surface best-in-class models for certain tasks, especially if you're exploring and new to AI.
What's next
We're already working on the next set of updates, including an updated playground built around a schema-based architecture, as introduced in our recent documentation update. This will make it much easier to configure requests and work with models more freely, including with LLMs and agents.
We'll be moving quickly from here. If you have feedback or requests, let us know. We're listening and will continue iterating fast!